Grant funding data for 2022/23
We publish a summary of our grant funding data every year to show how we spend our money.
We update this information every year. The most recent data is for the period from 1 October 2022 to 30 September 2023. You can find further details on our finances in our annual reports.
How many grant applications did we receive?
The number of grants we make and their value varies from year to year, depending on the scale and type of funding programmes we offer, when in the year we open and close funding rounds or when we renew funding for major initiatives.
In 2022/23, we received 1,852 applications for funding and made 626 awards worth £1.2bn – compared to 577 grants worth £1.5bn in 2021/22.
Amount awarded by financial year (£mn)
Chart visible
Bar chart showing the amount Wellcome has awarded in funding by financial years since 2018/19.
Bar chart showing the amount Wellcome has awarded in funding by financial years since 2018/19.
Where do we fund?
Grants awarded in 2022/23
In 2022/23, we awarded grants to researchers based at 460 organisations across 75 countries.
When viewed by the number of grants made:
- 79.7% of grants awarded were to UK-based researchers
- 12.1% of grants awarded were to other high-income countries
- 8.3% of grants awarded were to low and middle-income countries
When viewed by the value of grant funding:
- 52% of our funding was in the UK
- 48% of our funding supported research overseas; 30.9% was awarded directly to overseas institutions and 17.1% was awarded via a UK grantee working with an international collaborator
- 25.2% of our funding supported research in lower and middle-income countries
All active grants
Most of our grants last for several years. As of 30 September 2023, we had 3,098 active grants to researchers based at a total of 1,042 organisations across 119 countries.
Researchers based outside the UK received 37.4% of our active funding:
- 27.8% (£1.9bn) directly supported research at organisations outside the UK (see map below), compared to 24% in the previous year
- 9.6% (£700mn) supported research internationally via UK organisations working with international collaborators, compared to 7% in the previous year
In the UK, we have 2,686 active grants held by researchers across 157 organisations.
Active grant portfolio by adminstering organisation country
Map visible
An interactive world map that shows Wellcome's active grant portfolio at the end of the financial year 2022/23.
Sorted alphabetically by country
An interactive world map that shows Wellcome's active grant portfolio at the end of the financial year 2022/23.
UK administering organisations with more than £50mn in active funding
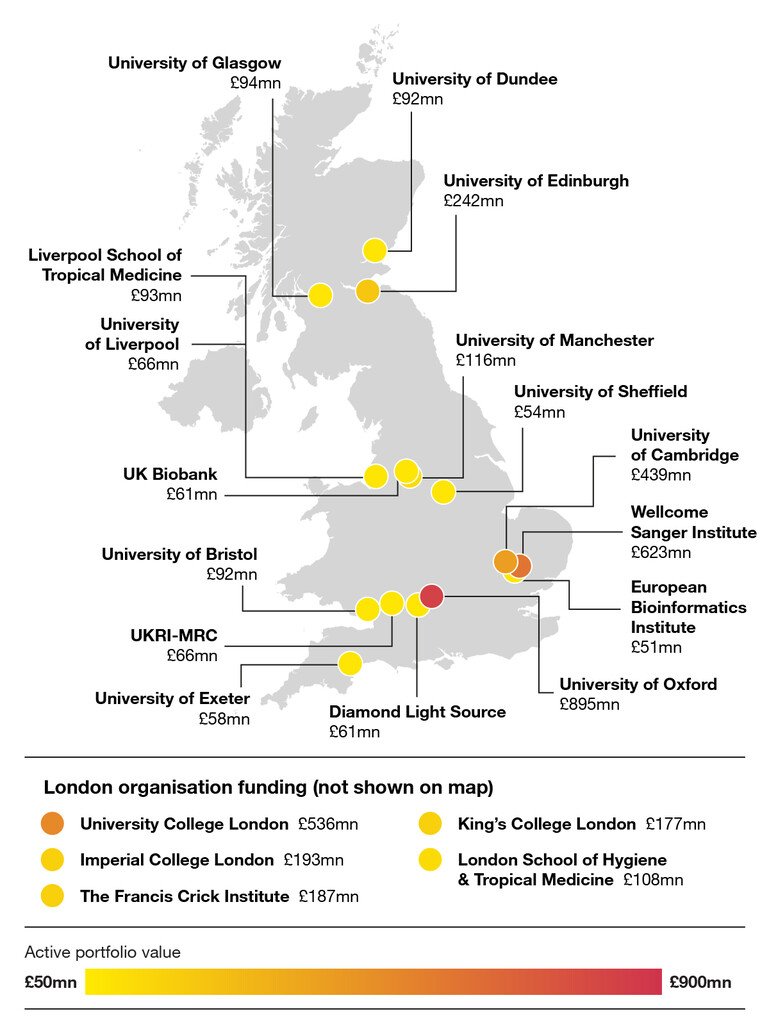
UK map showing the organisations administering the largest sums of active funding to researchers in the UK at the end of the financial year 2022/23
Pages 144-149 of our 2023 annual report set out all organisations administering grants totalling more than £10mn awarded in 2022/23.
Who do we fund?
All the data below relates to the lead applicant or principal investigator for a grant. Download the data for more detailed breakdowns [XLSX 29KB].
Applications in 2022/23
Of the applications we received where the lead applicant provided the relevant information:
- 45.5% were from women
- 3.8% were from disabled researchers
- 64.6% were from UK-based researchers, 16.0% from other high-income countries and 19.4% from low and middle-income countries
- globally, 62.7% were from white researchers, 17.4% from Asian or Asian British researchers, 11.6% from Black or Black British researchers and 8.3% from researchers of mixed or other ethnicities
- in the UK, 76.1% were from white researchers, 13.7% were from Asian or Asian British researchers, 3.6% were from Black or Black British researchers and 6.6% from researchers of mixed or other ethnicities
Grants in 2022/23
Of grants we awarded where the lead applicant provided the relevant data:
- 49.7% were to women
- 3.8% were to disabled researchers
- 71.5% were to white researchers, 13.5% to Asian or Asian British researchers, 7.8% to Black or Black British researchers and 7.3% to researchers of mixed or other ethnicities
- in the UK, 75.7% of awards were to white researchers, 13.5% to Asian or Asian British researchers, 4.9% were to Black or Black British researchers and 6.0% to researchers of mixed or other ethnicities
Success rates in 2022/23 for our competitive grants
Most of our grants are awarded through open competitive schemes or calls. This data shows how success rates in this process vary.
This is the proportion of total eligible applications for our competitively assessed grants that were successful, where the lead applicant provided the relevant data.
Success rates were 18.8% for men and 19.1% for women.
Globally, success rates were 22.4% for white applicants compared to 13.5% for applicants from other backgrounds (Black, Asian, mixed and other ethnicities). This is a larger gap than in 2021/22, where success rates were 12.5% for white applicants compared to 9.3% for applicants from other backgrounds.
Award success rates by ethnicity in 2022/23
Chart visible
Bar chart showing the award success rates of white applicants and applicants from other backgrounds* based in the UK and outside the UK in the financial year 2022/23.
*A grouping of Asian or Asian British, Black or Black British, Mixed Ethnicity or Other Ethnicity has been provided where numbers are too low to calculate success rates for these groups individually.
In the UK, award rates were 25.2% for white applicants and 23.9% for applicants from other backgrounds.
For this data, we follow the UK Census ethnic group categorisation.
Award success rates by geography in 2022/23
Chart visible
Bar chart showing the award success rate of applicants based in the UK, other high-income countries and low and middle-income countries in the financial year 2022/23.
Bar chart showing the award success rate of applicants based in the UK, other high-income countries and low and middle-income countries in the financial year 2022/23.
Success rates were notably higher for UK-based applicants (25.1%) than for those based in other high-income countries (10.8%) or low and middle-income countries (9.8%). This is a larger gap than in 2021/22, where success rates were somewhat higher for UK-based applicants (12.1%) and those based in other high-income countries (12.3%) than for low and middle-income countries (7.9%)
The increase in the gaps in success rates between UK-based applicants and others, and between white applicants and others, was mostly caused by the end of several funding programmes. These programmes attracted a high volume of UK applicants and had low success rates. Once we closed these programmes, the number of applications we received from UK researchers went down and the proportion that were successful increased. As the majority of UK applicants are white, this also affected the overall success rates for white applicants.
We continue to consider what more we can do to support applications from low and middle-income countries. Last year we ran information and advice webinars for potential applicants with live interpretation in Spanish, Portuguese, Vietnamese, Thai, French and Swahili, attended by researchers from 118 different countries.
Expert advisory panels
We have diversity targets for our external expert panels that assess funding applications.
Of Wellcome’s expert advisory panel members in 2022/23:
- 59% were women (target 50%)
- 31% were from racially minoritised backgrounds (target 25%)
- 29% were from outside the UK (target 50%)
- 36% were early-mid career researchers (target 25%)
- 3.6% were disabled (target 5%)
Tags