Funded people and projects
Find out about the people and projects we've funded, including grants awarded and the latest grant funding data.
We fund transformative curiosity-driven research, and we’re taking on three of the biggest health challenges facing humanity – climate change, infectious disease and mental health.
As of 2021/22 year-end, Wellcome’s active grant research portfolio comprises 3,242 awards worth more than £7.1 billion. This has increased by 25% since 2019/20.
Grants awarded
Search our database of project summaries written by current and past grantholders.
Download a spreadsheet of grants awarded since October 2005.
Wellcome grants awarded 1 October 2005 to 30 September 2023 [XLSX 11.87MB]
These spreadsheets have been created using the 360Giving data standard. The work is licensed under the Creative Commons Attribution 4.0 International Licence, which means the data is freely available to anyone to be used and shared as they wish. The data must be attributed to Wellcome.
View biomedical research grants funded by Wellcome and other global research funders on the World RePORT database, hosted by the National Institutes of Health.
Grant funding data for 2021/22
Wellcome’s financial reporting year runs from October to September. The financial year 2021/22 ran from 1 October 2021 to 30 September 2022.
In 2021/22, the way we fund research changed to support our new strategy.
The awards in 2021/22 include those made under the final rounds of our previous schemes and those awarded through our new Discovery Research, Infectious Disease, Mental Health and Climate and Health research programmes.
This means that not all the data from this year is comparable with previous years.
In 2021/22, we received 2,756 applications for funding and made 629 awards worth almost £1.5bn – an increase from £1.1bn in 2019/20.
Where does Wellcome fund?
Our funding is global – in 2021/22, we made awards to 353 organisations across 65 countries.
As of 2021/22 year-end, Wellcome’s active grant portfolio includes funding to 958 organisations across 110 countries.
24% (£1.7bn) of the portfolio is directly awarded to organisations outside the UK (see map below). In addition, 7% (£532mn) is awarded internationally via UK organisations.
Figure 1: Amount awarded by financial year (£mn)
Source: Wellcome
Bar chart showing the amount Wellcome has awarded in funding by financial years since 2017/18.
Note: 'Amount Awarded' shows new funds committed each year, so can vary substantially across years depending on the timing of large awards. This differs from our financial reporting, where large multi-year awards are often shown spread across years,
Figure 2: Active grant portfolio at the end of the financial year 2021/22
Source: Wellcome
An interactive world map that shows Wellcome's active grant portfolio at the end of the financial year 2021/22. Hover over or select a country to see the portfolio value.
Sorted alphabetically by country
Source: Wellcome
An interactive world map that shows Wellcome's active grant portfolio at the end of the financial year 2021/22. Hover over or select a country to see the portfolio value.
45% (£3.1bn) of our grant portfolio is administered by five UK organisations – Wellcome Sanger Institute, University of Oxford, University College London, University of Cambridge and Francis Crick Institute.
Figure 3: UK administering organisations with more than £50mn in active funding at the end of the financial year 2021/22
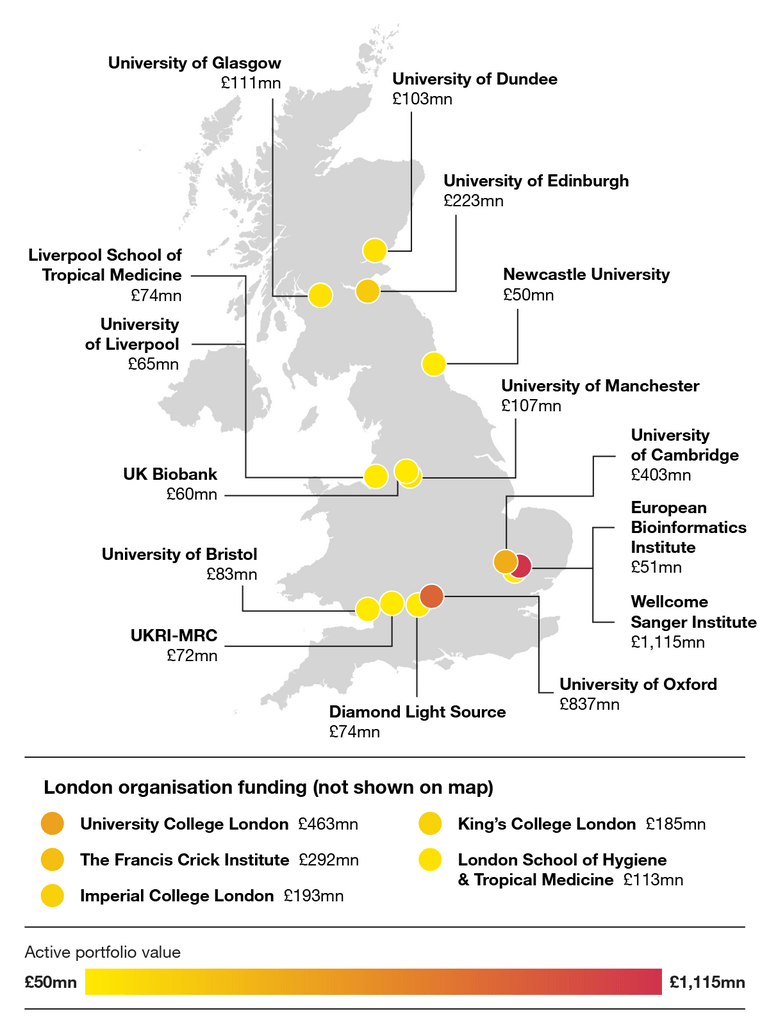
UK map showing administering organisations with more than £50mn in active funding at the end of the financial year 2021/22.
Who does Wellcome fund?
In 2021 we published our diversity and inclusion strategy, which included our commitment to ensuring the people we fund are more representative of the global population. Continuing to publish our grant funding data is part of our commitment to getting there.
Applications in 2021/22
Figure 4: Ethnicity of lead applicant for applications in the financial year 2021/22
Source: Wellcome
Bar chart showing the proportion of applications received per ethnicity group of the lead applicant in the financial year 2021/22.
Note: Applications where no diversity data was provided or the lead applicant responded 'Prefer not to say' (or 'Prefer to self describe' in the context of ethnicity) have been excluded in this analysis. 93% of applications are therefore included when viewing applicant ethnicity.
- 66% of applications we received were from White researchers (down from 71% in 2019/20), 13% from Asian or Asian British researchers, 12% from Black or Black British researchers and 9% from researchers of mixed or other ethnicities.
- In the UK, a higher proportion (77%) of applications were from White researchers, and just 51 applications (2.7%) were from Black or Black British researchers
Figure 5: Gender of lead applicant for applications in the financial year 2021/22
Source: Wellcome
Bar chart showing the proportion of applications received per gender of the lead applicant in the financial year 2021/22.
Note: Applications where no diversity data was provided or the lead applicant responded 'Prefer not to say' (or 'Prefer to self describe' in the context of gender) have been excluded in this analysis. 95% of applications are therefore included when viewing applicant gender.
- 47% of applications we received were from women, the same proportion as in 2019/20.
- Women continue to make up a smaller proportion of applicants for awards of higher financial value.
Figure 6: Disability status of the lead applicant for applications in the financial year 2021/22
Source: Wellcome
Bar chart showing the proportion of applications received by disability status of the lead applicant in the financial year 2021/22.
Note: Applications where no diversity data was provided or the lead applicant responded 'Prefer not to say' (or 'Prefer to self describe' in the context of disability) have been excluded in this analysis. 92% of applications are therefore included when viewing applicant disability.
- 3.1% of applications were from disabled researchers, compared with 4.1% in 2019/20.
Figure 7: Ethnicity of lead applicant for awards granted in the financial year 2021/22
Source: Wellcome
Bar chart showing the proportion of awards made per ethnic group in the financial year 2021/22.
Note: Awards where no diversity data was provided or the lead applicant responded 'Prefer not to say' (or 'Prefer to self describe' in the context of ethnicity) have been excluded in this analysis. 88% of applications are therefore included when viewing applicant ethnicity.
- 72% of awards were made to researchers from White backgrounds (down from 81% in 2019/20), 12% to Asian or Asian British researchers, 8% to Black or Black British researchers and 9% to researchers of mixed or other ethnicities.
- We made 13 awards to Black or Black British researchers based at UK organisations.
Figure 8: Gender of the lead applicant for awards granted in the financial year 2021/22
Source: Wellcome
Bar chart showing the proportion of awards received by gender of the lead applicant in the financial year 2021/22.
Note: Awards where no diversity data was provided or the lead applicant responded 'Prefer not to say' (or 'Prefer to self describe' in the context of gender) have been excluded in this analysis. 92% of applications are therefore included when viewing applicant gender.
- 49% of awards were made to women, the same proportion as in 2019/20.
Figure 9: Disability status of the lead applicant for awards in the financial year 2021/22
Source: Wellcome
Bar chart showing the proportion of awards received by the disability status of the lead applicant in the financial year 2021/22.
Note: Awards where no diversity data was provided or the lead applicant responded 'Prefer not to say' (or 'Prefer to self describe' in the context of disability)have been excluded in this analysis. 92% of applications are therefore included when viewing applicant disability.
- 2.5% of awards were made to disabled researchers, compared to 3.5% in 2019/20.
Award rates in 2021/22 for our competitive schemes and funding calls
- Award rates were 12.5% for White researchers compared to 9.5% for researchers from racially marginalised backgrounds (Black, Asian, mixed and other ethnicities) (up from 7.5% in 2019/20).
- Award rates were similar for men (11.4%) and women (11.2%).
- Data for disabled applicants is too low to report.
Expert advisory panels
We have worked to diversify our expert advisory panels, which shortlist and interview applicants.
Of Wellcome’s expert advisory panel members in 2021/22:
- 55% were women, up from 48% in 2019/20.
- 23% were from racially marginalised backgrounds, up from 15% in 2019/20.
- 45% were from outside the UK, up from 39% in 2019/20.
- 51% were early-mid career researchers (data not reported in 2019/20).