Chapter 3: Trust in science and health professionals
This is chapter 3 of the Wellcome Global Monitor 2018
Read all chapters
Summary
- Globally, 18% of people have a high level of trust in scientists, while 54% have a medium level of trust, and 14% have low trust. The remaining 13% of people have no opinion about how much they trust scientists in their respective countries. This ranges from a third of people having 'high' trust in Australia and New Zealand, Northern Europe and Central Asia to around one in ten in Central and South America.
- The two main factors associated with a person’s level of trust in scientists are learning science at school or college and confidence in key national institutions (such as the government, the military and the judiciary). All other things being equal, people who have studied science at school are more likely to trust scientists, as do people who have confidence in key national institutions.
- However, the statistical analysis was able to explain only 15% of the variation in people’s trust in scientists, even when controlling for a number of factors, including personal background (gender, income, etc.) and other key variables.
- Other factors that are significantly associated with trust in scientists include where a person lives (rural or urban area), how people feel about their income and access to a personal telephone and the internet. All other things being equal, people who live in rural areas are more likely to trust scientists than people living in an urban area or a small town or village; as are those who feel comfortable on their present income and who have access to mobile phones and the internet.
- Perceptions of trust towards scientists are linked with an important social and economic trend affecting many countries throughout the world – rising income inequality. More economically unequal societies tend to have lower trust in scientists, even after controlling for a country’s wealth or development status, a statistical analysis shows.
- Globally, 73% of people say they would trust a doctor or a nurse more than several other possible sources of health advice, including family, friends, religious leaders or famous people. This figure ranges from a low of 65% in East Asia and the Middle East, to a high of nearly 90% in Northern Europe, Southern Europe, Northern America and Australia and New Zealand. There are few differences in trust in doctors and nurses when considering key demographics, such as age, gender and education.
- People in high-income countries are about as likely to have confidence in hospitals and health clinics in their country as lower-middle-income countries (78% and 82% respectively).
- Personal household income may be a more important factor in shaping confidence in hospitals and health clinics than national income. People who say they find it difficult to get by on their present income are notably less likely to say they have confidence in their country’s hospitals and health clinics.
- Worldwide, more than eight in ten people (84%) say they trust medical and health advice from medical workers (such as doctors and nurses) but this decreases to 76% for trust in that same advice from the government.
In this chapter:
- Introduction
- The development of a new measure of trust: the Wellcome Global Monitor Trust in Scientists Index
- Understanding the predictors of trust in scientists
- Country and individual-level characteristics that influence trust in scientists
- Confidence and trust in health professionals and hospitals
- Confidence in hospitals and health clinics
- Who people trust the most to give them medical or health advice
- Conclusion
Introduction
The work of research scientists and health professionals profoundly impacts upon the public’s ability to lead good and healthy lives. Public involvement and trust in science and health is important so that we can be sure that the work that scientists do reflects the needs and priorities of society, and in so doing, this work is valued and trusted by the public.
People’s attitudes to science are a product of a set of complex interrelated individual and societal factors,1,2,3 which were summarised in Chapter 1.
This chapter focuses on an essential part of attitudes to science: trust in science, scientists, and healthcare professionals.
Box 3.1: Main research topics addressed in this chapter
- To what extent do people trust scientists and the work that scientists do? How does trust vary on a regional or country-by-country basis?
- What demographic characteristics (such as gender, age, education level, etc.) or other factors influence people’s trust in scientists?
- How does trust in scientists fare compared to trust in other societal institutions, such as government, the media and the people who live in the same neighbourhood?
- What is the current state of trust in doctors and nurses in different parts of the world? Who would people trust the most to give them health and medical advice?
Wellcome Global Monitor questions examined in this chapter
- How much do you trust scientists in this country?
- In general, how much do you trust scientists to find out accurate information about the world?
- How much do you trust scientists working in colleges/universities in this country to do their work with the intention of benefiting the public?
- How much do you trust scientists working in colleges/universities in this country to be open and honest about who is paying for their work?
- How much do you trust scientists working for companies in this country to do their work with the intention of benefiting the public?
- How much do you trust scientists working for companies in this country to be open and honest about who is paying for their work?
- In general, how much do you trust medical and health advice from medical workers, such as doctors and nurses, in this country?
- In (country name), do you have confidence in hospitals and health clinics?
- How much do you trust each of the following? Do you trust them a lot, some, not much, or not at all? How about – the people in your neighbourhood, the national government in this country, scientists in this country, journalists in this country, doctors and nurses in this country, people who work at charitable organisations/NGOs in this country, traditional healers [or local equivalent] in this country?
- Which of the following people do you trust most to give you medical or health advice? Your family and friends, a doctor or nurse, a religious leader, a famous person, a traditional healer [or country equivalent], other?
- In general, how much do you trust medical and health advice that the government gives? A lot, some, not much, or not at all?
Pressing play on the video above will set a third-party cookie. Please read our cookie policy for more information.
The development of a new measure of trust: the Wellcome Global Monitor Trust in Scientists Index
Box 3.1 lists 11 questions that were asked in the Wellcome Global Monitor in reference to various aspects regarding trust in scientists and health sector professionals. Statistical analysis4 was used to determine which of those items were most suitable to develop a composite measure of trust in scientists in each country. Five of those items were determined as the most relevant and were combined to create a composite measure of trust in scientists. A person’s overall trust in scientists – or their Index score – is based on how they answered the five questions. Box 3.2 and Appendix A: Methodology [PDF 540KB] present more detail about how the index was constructed.
Box 3.2: About the Wellcome Global Monitor Trust in Scientists Index
The Wellcome Global Monitor examines public trust in scientists from several different perspectives. In a series of five questions, individuals are asked to rate how much they trust different aspects or expectations of scientists (see Table 3.1). The Wellcome Global Monitor Trust in Scientists Index, which is a measure of overall trust, is based on how an individual responded to each of these survey items.
Questions about trust in scientists
- How much do you trust scientists in this country? A lot, some, not much or not at all?
- In general, how much do you trust scientists to find out accurate information about the world – a lot, some, not much or not at all?
- How much do you trust scientists working in colleges/universities in this country to do their work with the intention of benefiting the public? A lot, some, not much or not at all?
- How much do you trust scientists working in colleges/universities in this country to be open and honest about who is paying for their work? A lot, some, not much, not much or not at all?
- How much do you trust scientists working in colleges/universities in this country to be open and honest about who is paying for their work? A lot, some, not much or not at all?
- How much do you trust scientists working for companies in this country to do their work with the intention of benefiting the public? A lot, some, not much or not at all?
Table 3.1: Individual questions of Wellcome Global Monitor Trust in Scientists Index
How the index is scored
The Wellcome Global Monitor Trust in Scientists Index is calculated at the individual level, first by scoring the amount of trust a person expressed in each of the underlying survey questions. The response 'a lot' of trust was assigned 4 points; 'some' trust was assigned 3 points; 'not much' trust 2 points and 'not at all' 1 point. Responses that did not indicate an opinion (e.g. 'don’t know') were not treated as valid for this analysis and were not scored. Only respondents who gave a valid response to at least three of the five survey questions received an overall Index score, which is the simple average of their scores. The Wellcome Global Monitor Trust in Scientists Index has a range of one to four, inclusive.
Finally, people were classified into one of three levels of trust – high, medium or low – depending on their overall Index score. People who did not answer at least three of the questions were described as not having an opinion.
| Level of trust | Index range |
|---|---|
| High | Above 3.5 to 4 |
| Medium | 2.5 to 3.5 |
| Low | 1 to below 2.5 |
| No opinion | No score |
The following section will discuss the results of the Index for each region and country-income grouping. This will be followed by an analysis of the factors that influence people’s trust in scientists, and a discussion of the global results on the levels of trust people have in the health sector and in medical professionals in their countries.
Worldwide, the majority of people (54%) have 'medium' trust in scientists, while almost one in five people have a 'high' level of trust, and one in seven have 'low' trust in scientists
Globally, 54% of people have a 'medium' level of trust in scientists, according to the Wellcome Global Monitor Trust in Scientists Index. Fewer than one in five people (18%) have a 'high' level of trust in scientists, and one in seven people (14%) have a 'low' level of trust in scientists. Another 13% of individuals did not offer an opinion on a majority of the individual questions asked as part of the Index (see Box 3.2).
Regionally, the largest proportion of people who have a 'high' level of trust in scientists are in Australia and New Zealand, Northern Europe and Central Asia, where they make up about a third of the population. Fewer than one in ten people in these regions have a 'low' level of trust in scientists.
Chart 3.1: Trust in Scientists Index showing levels of trust by region
See the interactive version of this chart.
'Low' trust in scientists is most common in Central Africa, Southern Africa and South America
By contrast, almost one in three people in Central Africa, Southern Africa and South America have 'low' levels of trust in scientists. In Central America and Mexico, 27% of people have 'low' trust in scientists. In all of these regions, people with 'low' trust are more than twice as common as people with 'high' trust (as will be seen in the next chapter, these regions are also among the least likely to believe that science benefits them personally or benefits most people in their society).
Low-income countries have a higher percentage of people who have 'low' trust in scientists, compared to high-income countries
People in high-income countries are more likely than people in low-income countries to have a 'high' trust in scientists, although by only a relatively small margin, at 23% compared to 19%. Low-income countries also have a higher percentage of people who have 'low' trust in scientists, compared to people in high-income countries, with 18% of people in low-income countries having 'low' trust in scientists compared to 12% in high-income countries. Combining the two 'positive' categories together shows that 84% of people in high-income countries have either 'medium' or 'high trust' in scientists, compared to a combined figure of only 62% in low-income countries.
Chart 3.2: Trust in Scientists Index showing levels of trust by country-income group
See the interactive version of this chart.
Chart 3.3: Map of countries according to average Trust in Scientists index score
See the interactive version of this chart.
Uzbekistan, Belgium and Tajikistan have the highest proportions of people who have 'high' trust in scientists
The countries with the largest proportion of people who have 'high' trust in scientists are fairly diverse, with Uzbekistan having the highest percentage by a substantial margin (with 54% of people registering 'high' trust in scientists), followed by Belgium and Tajikistan (where 42% of people have 'high' trust in scientists). Taking 30% as a cut-off point – where 30% of people or more have a 'high' level of trust in scientists (Table 3.1) – the country results show that there is geographical diversity in the countries that register 'high' trust levels, and both high-income and low-income countries appear on this list.
Large percentages of people in Uzbekistan and Tajikistan have 'high' levels of trust in scientists; and that may reflect – to an extent – government policies in recent years to expand their respective nations’ scientific capacities, such as increasing funding for research and development5 and, in the case of Uzbekistan, opening new research universities. Both countries have also tended to emphasise science-related subjects in their educational curriculum, with 99% of people in Uzbekistan and 95% of people in Tajikistan saying that they learned science at school.6 As will be apparent in the analysis later in this chapter, learning science at school or college is a significant factor that, in general, can contribute to having higher trust in scientists.
Table 3.2: Trust in Scientists Index showing countries where people most likely to have high trust
Countries with the highest percentage of people in the 'high' trust (30% of people and above).
Wellcome Global Monitor Trust in Scientists Index
| High trust | Medium trust | Low trust | No opinion | |
|---|---|---|---|---|
| Uzbekistan | 54% | 38% | 2% | 6% |
| Belgium | 42% | 48% | 8% | 2% |
| Tajikistan | 42% | 41% | 9% | 8% |
| Niger | 39% | 30% | 14% | 17% |
| Spain | 39% | 54% | 6% | 1% |
| Ireland | 39% | 55% | 5% | 1% |
| Norway | 38% | 59% | 3% | 1% |
| United Kingdom | 35% | 55% | 9% | 1% |
| Finland | 35% | 58% | 7% | 0% |
| Malta | 34% | 53% | 7% | 6% |
| Portugal | 34% | 54% | 11% | 2% |
| The Gambia | 34% | 42% | 11% | 13% |
| Australia | 33% | 58% | 8% | 1% |
| Czech Republic | 33% | 43% | 16% | 8% |
| New Zealand | 32% | 61% | 5% | 2% |
| Philippines | 32% | 52% | 13% | 3% |
| Iceland | 32% | 63% | 4% | 2% |
| Denmark | 31% | 62% | 7% | 0% |
| Tanzania | 31% | 51% | 9% | 9% |
Eleven out of the 19 countries where more than 30% of people express 'high' trust in scientists are in Europe. Other research has found similar results for trust in scientists levels in Europe.7,8,9
It is notable that two low-income countries that have low levels of educational attainment are among those with the highest trust in scientists. In Niger, 39% of people have a 'high' level of trust, higher than any other African country. Yet Niger has one of the highest rates of people who do not have formal education,10 and 65% of people, when asked to assess their own knowledge of science, said they know 'nothing at all' or said they did not know. While this is the case, according to agricultural scientists, the last few years have seen one of the largest positive re-greening efforts of the environment,11,12 which has directly benefited farmers across the country.
Another low-income country with relatively 'high' trust in scientists is The Gambia, where 34% had a 'high' level of trust. It is noteworthy that the fielding of the Wellcome Global Monitor survey in The Gambia overlapped with the country’s first national science week, potentially influencing sentiment towards science at that time.
Box 3.3: US and EU most trusting of scientists among 'the Big 5'
According to the UNESCO Science Report 2015, the European Union states, China, the United States, Japan and Russia – or 'the Big 5' – are home to 72% of all researchers in the world. As sizeable as these countries’ research sectors might be, people from a 'Big 5' country are about as likely to have 'high' trust in scientists as people from elsewhere in the world, at 20% to 17%. However, people who do not live in a 'Big 5' country are twice as likely as those living in a leading research country to have 'low' trust in scientists (9% and 17% respectively).
Trust in scientists also varies among the individual countries of the European Union. The United Kingdom has a higher degree of trust in scientists than, for instance, France and Germany, with 35% of people in that country having ‘high’ trust. This is also ten percentage points higher than the United States. In France, slightly more than one in five people (21%) have ‘high’ trust, while this figure is 24% in all other EU countries. However, rates of ‘low’ trust are similar in each of these countries.
In China, which has seen a remarkable growth in its scientific capabilities in recent decades, 21% of people have no opinion with respect to their trust in scientists. Chinese people living in rural areas – about 42% of the population according to the World Bank – are particularly likely to have no opinion on this matter, compared to those living in an urban area, at 26% to 15% respectively. Still, more people in China have a 'high' rather than a 'low' level of trust in scientists (19% compared with 7% respectively).
In Russia, there are an equal number of people – 14% – who have 'low' trust in scientists as have 'high' trust, and 62% of Russians have 'medium' trust in scientists. In Japan, 76% of people have a 'medium' level of trust in scientists, while only 7% have 'low' trust and 11% register 'high' trust in scientists.
Box 3.3: US and EU most trusting of scientists among 'the Big 5'
| High trust | Medium trust | Low trust | No opinion | |
|---|---|---|---|---|
| All 'Big 5' countries | 20% | 57% | 9% | 14% |
| China | 19% | 53% | 7% | 21% |
| USA | 25% | 56% | 13% | 6% |
| Japan | 11% | 76% | 7% | 5% |
| Russia | 14% | 62% | 14% | 10% |
| European Union (all countries) | 25% | 61% | 11% | 2% |
| France | 21% | 69% | 9% | 1% |
| Germany | 25% | 62% | 12% | 2% |
| UK | 35% | 55% | 9% | 1% |
| All other EU countries | 24% | 61% | 11% | 3% |
| Non-Big 5 countries | 17% | 53% | 17% | 13% |
Gabon and Burundi have the highest percentage of people with 'low' trust
With nearly half of its people (47%) expressing a 'low' level of trust in scientists, Gabon is the most sceptical nation of the over 140 countries included in the Wellcome Global Monitor. But this scepticism is not confined to scientists – only 30% of people in Gabon said they have 'a lot' or 'some' trust in people in their neighbourhood – the lowest level of any country. People in Gabon confidence in the major institutions in the country (such as the government, the judiciary, the media, etc.) also ranks among the lowest of all the countries included in the 2018 Gallup World Poll.
In the countries that have the largest proportion of people with 'low' trust in scientists – Burundi (42%), Togo (41%), Montenegro (41%), Republic of the Congo (40%), Benin (40%) and Guatemala (40%) – most also show widespread lack of confidence in their major societal institutions, an attitude that may lower a person’s trust in scientists.
Table 3.3: Trust in Scientists Index showing countries where people most likely to have low trust
Countries with highest percentage of people with 'low' trust (35% of people and above)
Wellcome Global Monitor Trust in Scientists Index
| High trust | Medium trust | Low trust | No opinion | |
|---|---|---|---|---|
| Gabon | 9% | 34% | 47% | 11% |
| Burundi | 16% | 26% | 42% | 17% |
| Togo | 1% | 18% | 41% | 40% |
| Montenegro | 3% | 39% | 41% | 17% |
| Republic of the Congo | 11% | 25% | 40% | 23% |
| Benin | 14% | 27% | 40% | 19% |
| Guatemala | 8% | 44% | 40% | 8% |
| Albania | 10% | 46% | 39% | 4% |
| Nicaragua | 8% | 47% | 39% | 7% |
| Panama | 7% | 51% | 38% | 3% |
| El Salvador | 9% | 49% | 38% | 4% |
| Peru | 5% | 49% | 38% | 8% |
| Moldova | 5% | 48% | 38% | 9% |
| Comoros | 11% | 36% | 38% | 15% |
| Namibia | 6% | 45% | 37% | 11% |
| Mauritania | 3% | 22% | 37% | 39% |
| North Macedonia | 5% | 43% | 36% | 16% |
| Ecuador | 8% | 53% | 35% | 4% |
| Bolivia | 5% | 52% | 35% | 7% |
| Bosnia Herzegovina | 2% | 55% | 35% | 8% |
Burundi, like other countries with a high proportion of people who have 'low' trust in scientists, has generally low educational exposure to science, with 76% saying they have never learned science at school, or only learned about science during the primary education stage. As the next section will show, educational exposure to science at school or college can also play a significant role in shaping a person’s views and trust in scientists.
Box 3.4: A closer look at those who have no opinion about trust in scientists
Globally, 13% of people did not offer an opinion in at least three of the five ‘trust in scientists’ survey questions. This category of people is sizeable in some regions – such as North Africa, (24%), Central Africa (20%), and East and Southeast Asia (19%). Although further research is needed, initial findings suggest that educational attainment levels may play a role in people having no opinion.
In countries such as Cambodia, Togo and Mauritania, around four in ten people fall into this category.
Notably, educational attainment levels in those countries are among the lowest in the world. This is no surprise, given how strongly linked low educational attainment is to having no opinion about trust in scientists: worldwide, people with a primary education or less are about three times more likely than people with a secondary education, and five times more likely than those with a post-secondary education, to have no opinion about the level of trust they have in scientists.
Additionally, women, older individuals and people living in urban areas are more likely, on balance, to have no opinion about the level of trust in scientists. Past research has found that these groups are also more likely not to answer other science-focused survey questions, such as items about factual knowledge.13
Understanding the predictors of trust in scientists
Trust in scientists, as we have seen above, varies across regions and countries. Existing research suggests that we should expect trust in scientists to vary along the lines of key demographic features, such as gender, age, education, or income.14,15 In this section, we explore how differences in people’s background, society and environment might influence overall trust in scientists. We will explore how people’s experience with science, such as learning the subject in school, influences their level of trust. In addition, we will investigate how some of the economy-wide factors may influence people’s trust in scientists.
A multivariate statistical analysis was performed in order to identify those factors that impact a person’s overall trust in scientists, even after accounting for other potentially confounding variables. More details on the statistical analysis can be found in the technical report online. This section will review the main findings from the analysis.
Box 3.5: Variables tested in the Trust in Scientists analysis
This analysis looks at the 'drivers' of trust in scientists – that is, the personal as well as national characteristics that lead to a higher score on the index. These are summarised below. Some of these factors, such as gender, educational attainment and income, have been identified in past studies as influential in shaping attitudes about science, if not specifically trust. By using Gallup World Poll questions, we were able to test the role of key attitudes, such as how a person rates their life overall, which have been found to shape a person’s perspective on a number of issues but not previously included in studies looking at attitudes to science.
The analysis also tested the role of country-level variables in shaping an individual’s trust level in scientists including the level of income inequality in a society. The latter is measured using the Gini Index, which estimates how evenly distributed a country’s overall income is among its population. The Gini Index can take a value anywhere between 0, which indicates perfect equality, and 100, which indicates perfect inequality.
Individual-level variables:
- Demographic factors: gender, age, urban/rural residence, educational attainment, income
- Knowledge of science: learned science in formal educational environment, self-assessed knowledge of science
- Key attitudes: Gallup World Poll Life Evaluation Index, feelings about household income
- Access to communications: access to communications devices (mobile phones and internet)
- Religious background: if person identifies with specific religion, says religion is important
- Confidence in national institutions: confidence in military, confidence in judicial system, confidence in the national government.
Country-level variables:
Gini Index, GDP per capita, World Bank income level, life expectancy at birth, mortality rate, research and development expenditure as percentage of GDP, average GDP growth rate (data source: World Bank).
Trust in scientists in this analysis focused on a person’s original score on the Trust in Scientists Index (see Box 3.2 or, for further detail, Appendix A: Methodology [PDF 540KB]), rather than the categories of high, medium or low trust that were featured in previous sections. The use of the original score allows for a greater level of granularity in the analysis.
Country and individual-level characteristics that influence trust in scientists
A person’s overall trust in scientists is likely to be shaped by both personal and country-level factors (see Box 3.5).16
A 2015 UNESCO Science Report stated that 'good governance is good for science' – an observation that indicates that scientific research is hampered by corruption and weak national institutions.17 Therefore, in the statistical analysis to explore the drivers of trust in scientists, we added a variable to test the hypothesis that an individual’s confidence in national institutions may influence their overall trust in scientists.18
This analysis seeks to identify which of these factors are most influential in determining trust in scientists, even after accounting for all other relevant characteristics.
Box 3.6: Educational exposure to science, confidence in national institutions and inequality significantly influence trust in scientists
The main findings are that, broadly speaking, the factors that are more influential (statistically significant) in shaping trust in scientists are:
- a person’s educational exposure to science
- confidence in key national institutions, including the government, military and the judiciary
- urban/rural residence
- feelings about household income (the extent to which a person finds it difficult to live on present income)
- the level of income inequality in the country (as represented by the Gini Index), and
- access to communications: mobile phones and the internet.
At the individual level:
- Having the opportunity to learn science at school is the single most influential predictor of trust in scientists, even after taking into account other potentially relevant personal or country factors.
- The level of confidence people have in the major institutions of their country matters. People who lack confidence in these key institutions, including the national government, the judicial system and the military, also have lower trust in scientists.
- People who have regular access to the internet and a telephone for personal use tend to have higher trust in scientists, all other things being equal.
At the country level:
- At the macroeconomic level, the level of income inequality in a country matters. People in high-inequality countries have lower confidence in scientists.
- While the findings were important and significant, the analysis only accounted for a portion of the variation in trust levels, and further research and data are needed to identify what other factors can help explain people’s overall trust in scientists.
All other factors tested were not found to have a statistically significant effect (please refer to the technical report online for a full listing of the estimated impact of all variables tested in the analysis).
While all of these variables had a statistically significant effect, not all had what can be described as meaningful clear effects on public trust in scientists.18 This is shown in Charts 3.4 and 3.5.
These two charts show how an individual’s predicted Trust in Scientists score changes for each of the factors (e.g. living in an urban area or a large city) included in the analysis.19
The results show that the effect of learning science at school (and the highest level at which people studied the subject) has the largest impact on an individual’s trust in scientists. For example, the model predicts that an individual with 'no formal education' in science would have a Trust in Scientists Index score of 2.8, while an individual with 'up to college' education in science would show a Trust in Scientists score of 3.1 (out of a maximum score of 4).
Whether a person has confidence in the national government or courts or believes the elections in their country are honest20 also impacts trust, albeit not to the same degree as learning science at school.
For ease of interpretation, we present margin plots for each of the significant variables in the final model. Margin plots present the model’s predicted Trust in Scientists Index score for a given variable level, keeping all other factors at their average level.
Chart 3.4: Margin plots for individual characteristics relating to trust in scientists
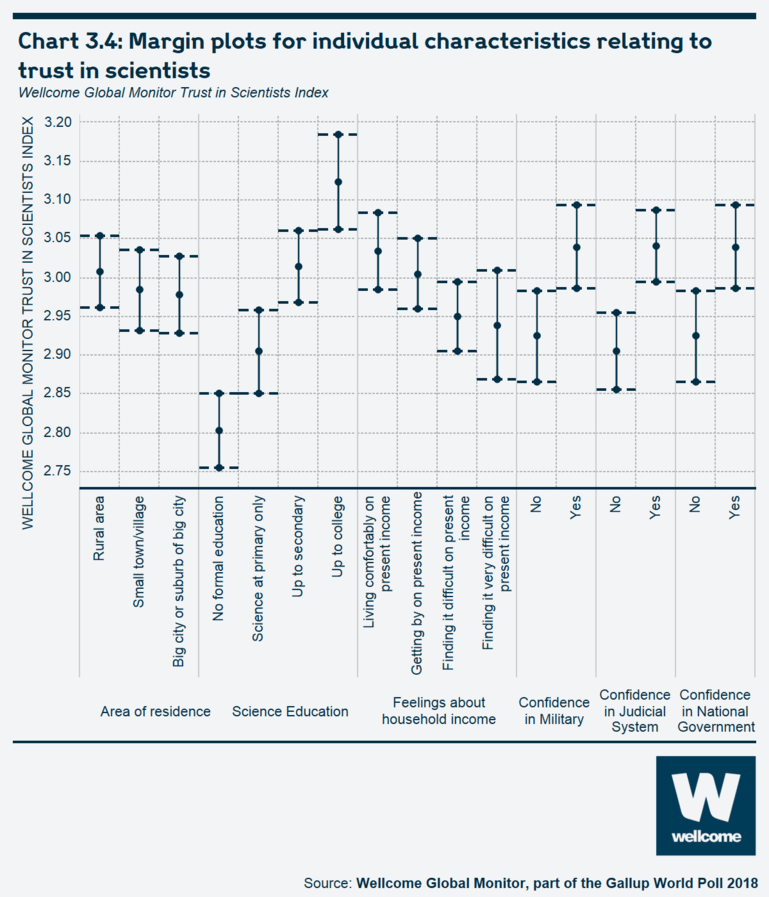
See the interactive version of this chart.
Chart 3.5 shows the margin plots of two other variables that were significant (but measured on a different scale)21: the Gini coefficient (higher scores represent greater inequality) as well as the Gallup World Poll Communications Access Index (higher scores represent greater access to communications). While the analysis found both items to have a statistically significant effect on trust in scientists, income inequality as measured by the Gini coefficient (discussed elsewhere in this report) had the more decisive impact, with predicted trust in science falling by as much as 20% between low- and high-income inequality countries.
Chart 3.5: Margin plots for country-level characteristics relating to trust in scientists
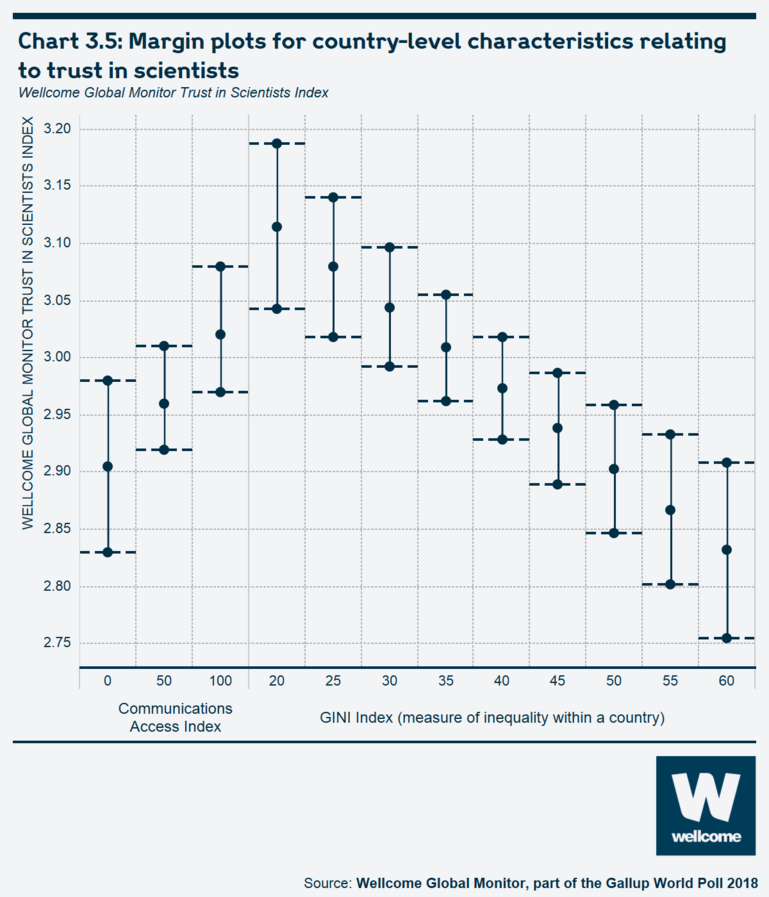
See the interactive version of this chart.
To further illustrate the effect of income inequality on trust in scientists, we looked at groups of countries that have low Gini values (more equal societies), and high Gini values (less equal societies).
Eleven countries have a relatively low Gini Index score of between 25 and 30 – a group that includes countries such as Iceland, Norway, Belgium and the Netherlands. For this group of countries – high-income, low-inequality countries – the average percentage of people who had a high level of trust in science was 30%.22
In the 23 high-income countries with a higher Gini Index of between 30 and 40 (that is to say, rich but more unequal societies) only 21% of people had a high level of trust in science.
For the group of five high-income countries with a Gini index higher than 40 (meaning relatively high income inequality) – including the United States, Argentina and Chile – the proportion of people having a high level of trust in science was lower still, at 19%.
The remaining factors used in the analysis, including gender, age and religious background, did not prove to have a statistically significant effect on overall trust in scientists.
However, the variables in this analysis explained only some 15% of the differences in people’s Trust in Scientists Index scores, which means they were unable to explain a substantial 85% of the differences in people’s scores. This indicates that important drivers were unaccounted for in the model, and further research and data are needed to better understand the factors affecting people’s trust in scientists.
Confidence and trust in health professionals and hospitals
Most people worldwide trust doctors and nurses, though trust is lower in Central Africa
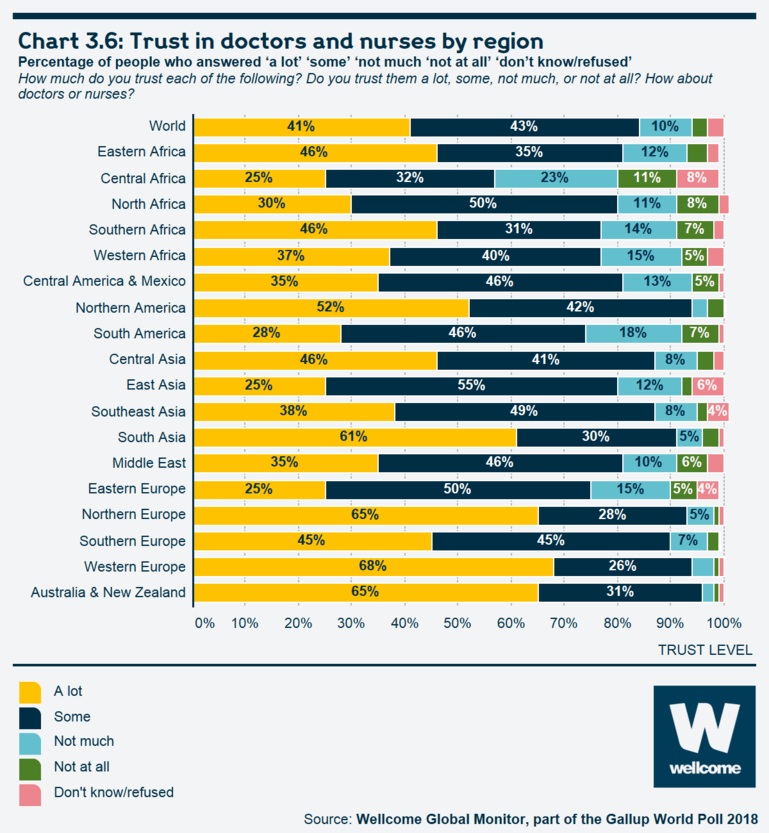
Worldwide, 84% of people have 'a lot' or 'some' trust in doctors; this breaks down to 41% who say they have 'a lot' of trust and 43% who have 'some' trust. This compares to only 13% who either have 'not much' trust, or 'not at all'. Globally, doctors and nurses are more trusted than any other group or organisation tested on the Wellcome Global Monitor, including 'people in your neighbourhood' (79% trust 'some' or 'a lot'), people who work at charitable organisations (59%), journalists (59%), the government (58%) and traditional healers (49%).
Chart 3.6: Trust in doctors and nurses by region
See the interactive version of this chart.
On a regional basis, Central Africa has the least amount of trust in doctors and nurses; 57% of people have 'some' or 'a lot' of trust, while slightly more than a fifth say they do not trust doctors much. Another 11% do not trust doctors 'at all'. Notably, key health outcomes in this region are among the lowest in the world, including life expectancy and the infant mortality rate.23
While most people globally have at least some trust in doctors and nurses, higher income areas, in general, are more likely to have the highest level of trust in these professionals, including in Western Europe, where 68% have 'a lot' of trust, and Australia and New Zealand and Northern Europe, where this figure stands at 65% for both regions.
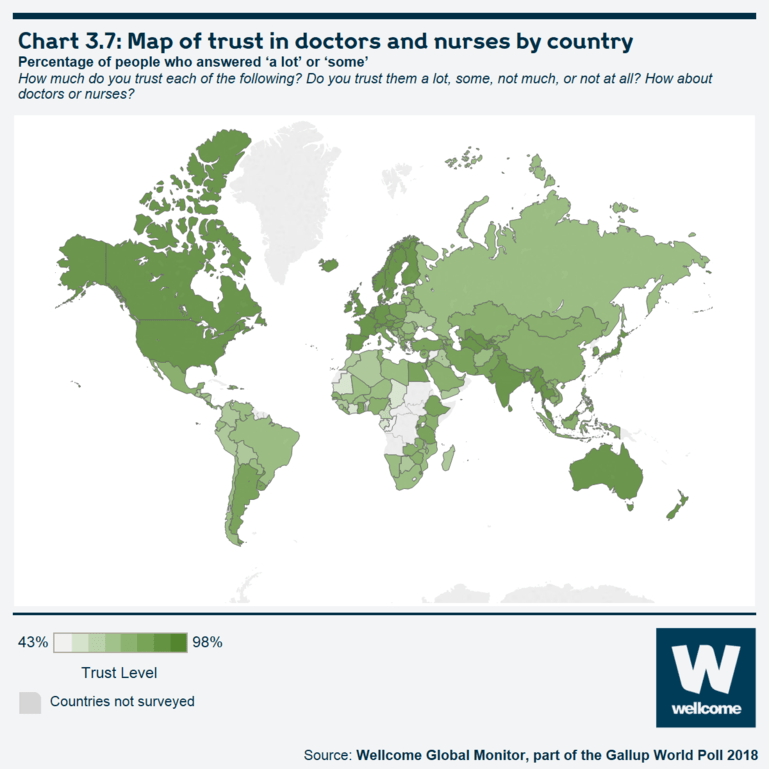
Chart 3.7: Map of trust in doctors and nurses by country
See the interactive version of this chart.
People in high-income countries are slightly more likely to have at least 'some' confidence in doctors and nurses than people who do not live in high-income countries, at 92% and 83% respectively; a gap that is due to the fact that 49% of people in high-income countries have 'a lot' of confidence in doctors or nurses compared to 40% of those in other countries.
Looking at how trust in doctors and nurses varies on a country-by-country basis, people in Africa are, on balance, relatively less trusting of these medical professionals than countries elsewhere in the world, including a number of the countries that were likely to express a low level of trust in scientists: the Republic of Congo (43% of people have 'some' or 'a lot' of trust in doctors/nurses), Benin (50%) and Gabon (50%).
At the other end of the trust spectrum, trust in doctors and nurses approaches universal levels in several countries, most of which are in high-income European nations. In Norway, Denmark, Spain, Finland, and Iceland, confidence is at 97% or higher.
Notably, a country’s level of trust ('a lot' or 'some') in doctors or nurses has a positive relationship with key metrics of national health outcomes, particularly life expectancy at birth24 – a finding that is consistent with past research.25
Chart 3.8: Scatterplot exploring the relationship between a country’s life expectancy at birth and people who trust doctors and nurses
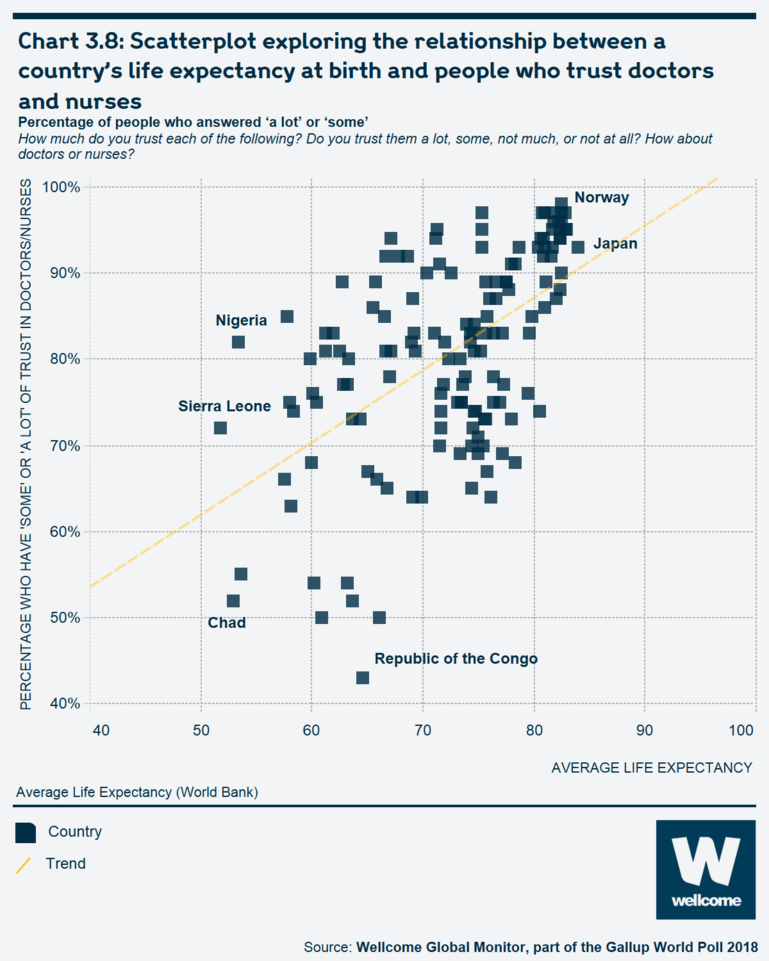
See the interactive version of this chart.
At the individual level, there are less apparent differences in trust in doctors and nurses along key demographics, such as age, gender and education, than had been observed in relation to trust in scientists measures. This finding is consistent with other studies that have found either no statistically significant effect or only a weak effect with respect to these demographics, especially compared to country-level differences in health outcomes.26
80% of people who are ‘finding it difficult’ or ‘very difficult’ to get by on their present income have ‘some’ or ‘a lot’ of trust in doctors and nurses, compared to 90% of those who are ‘living comfortably’. However, this trust gap is about as wide across all country-income groupings.
Confidence in hospitals and health clinics
Confidence in hospitals and health clinics is lowest in North Africa and Eastern Europe
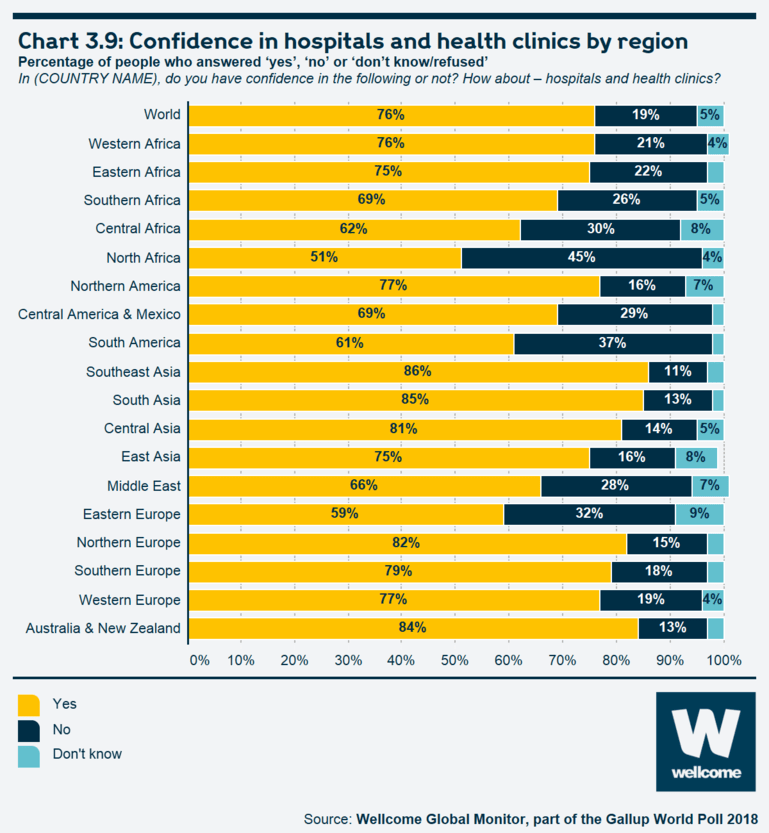
Worldwide, three-quarters of people say they have confidence in hospitals and health clinics in their country. In most regions throughout the world, at least seven in ten people have confidence in hospitals and health clinics, with the main exceptions in North Africa (51%) and Eastern Europe (59%).
Chart 3.9: Confidence in hospitals and health clinics by region
See the interactive version of this chart.
Confidence in hospitals and clinics relates more to personal, not national, income levels
At the country level, Rwandans are the most likely to express confidence in the hospitals and health clinics in their country (see Box 3.7) – with 97% expressing this sentiment. Other countries where people are most confident in their healthcare system include Malaysia (96%), Singapore (94%), Tajikistan (92%), Malta (92%), Denmark (90%) and Switzerland (90%). In general, these countries make healthcare services freely available to most, if not all, of their citizens.27
Chart 3.10: Map of confidence in hospitals and health clinics by country
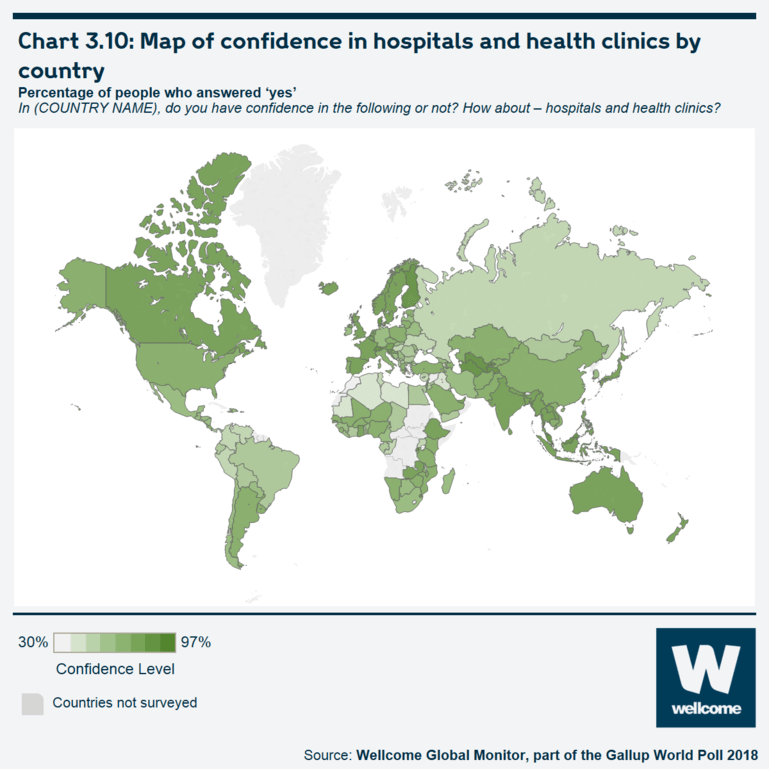
See the interactive version of this chart.
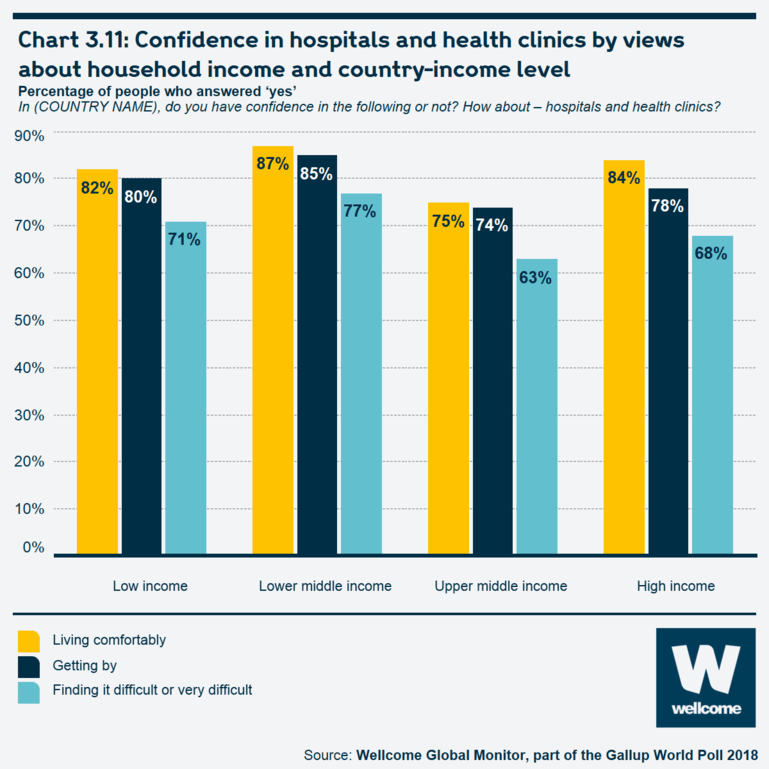
People in high-income countries are about as likely to have confidence in hospitals and clinics in their country as people in lower-middle-income countries
Notably, the countries with the highest levels of confidence in hospitals and health clinics are not exclusively high-income countries, despite clear differences between country-income levels in terms of health outcomes.28 Taken as a whole, people in high-income countries are about as likely to have confidence in hospitals and health clinics in their country as lower-middle-income countries (78% and 82%, respectively). Confidence in low-income countries, at 74%, is also close to the levels in high-income countries.
Box 3.7: Rwanda: High confidence in hospitals and health clinics
Rwandans are the most likely people worldwide to express confidence in their healthcare system, at 97%. This strong vote of confidence in the country’s healthcare system likely reflects the extraordinary improvements in the country’s healthcare system that have taken place over the past two decades. Over that time, life expectancy has increased by more than a third and the decrease in the infant mortality rate has been hailed by UNICEF as 'one of the most significant in human history.'29 More recently, the Gallup World Poll finds that the percentage of people in Rwanda who are satisfied with the quality of healthcare in their city or area has risen from 65% in 2008 to 82% in 2018.
People who say they 'find it difficult' to get by on their present income are less likely to say they have confidence in their country’s hospitals and health clinics
However, personal (or household) income, rather than national income, may be a more important factor in shaping confidence in healthcare. Globally, as well as in the different country-income groups, people who say they 'find it difficult' or 'very difficult' to get by on their present income are notably less likely to say they have confidence in their country’s hospitals and health clinics. Notably, the 'confidence gap' between people who say they are 'living comfortably' on their current income and those who say they are 'finding it difficult' or 'very difficult', is wider in high-income countries – with 84% of the former group expressing confidence in hospitals and health clinics compared to 68% of the latter group, a gap of 16 percentage points. In countries that are not high-income, this gap tends to be around 10 percentage points. This suggests income inequality plays a larger role in driving health outcomes in high-income countries, though further research on this topic is needed.
Chart 3.11: Confidence in hospitals and health clinics by views about household income and country-income level
See the interactive version of this chart.
Who people trust the most to give them medical or health advice
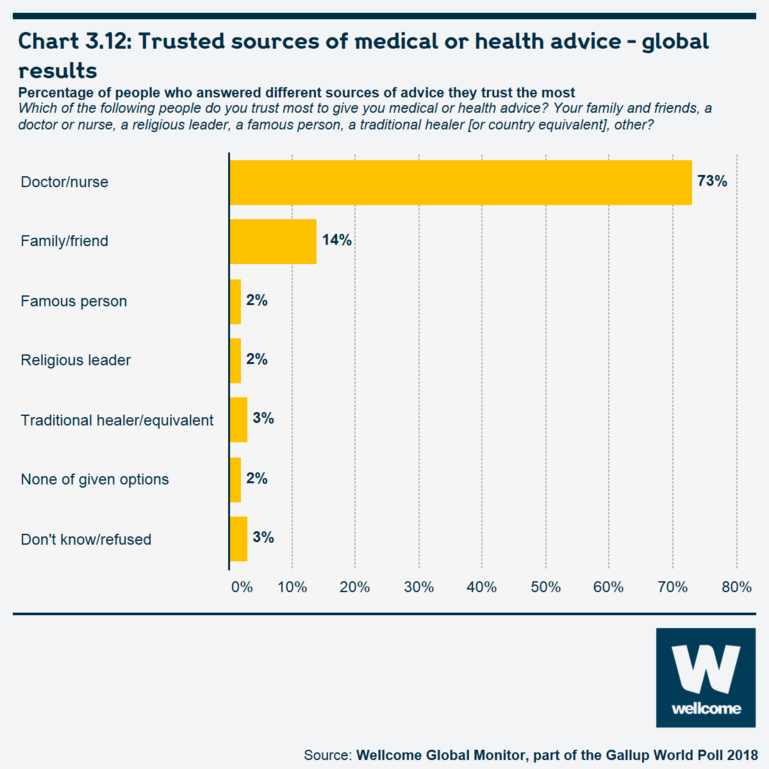
Globally, 73% of people say they would trust a doctor or a nurse the most to give them health advice
Consistent with the generally widespread trust in doctors and nurses, 73% of people worldwide say they would trust a doctor or a nurse the most to give them health advice – meaning 27% trust a different source more than a doctor or a nurse. The next most trusted sources are a person’s family or friends, with 14% saying this is who they would turn to for health advice.
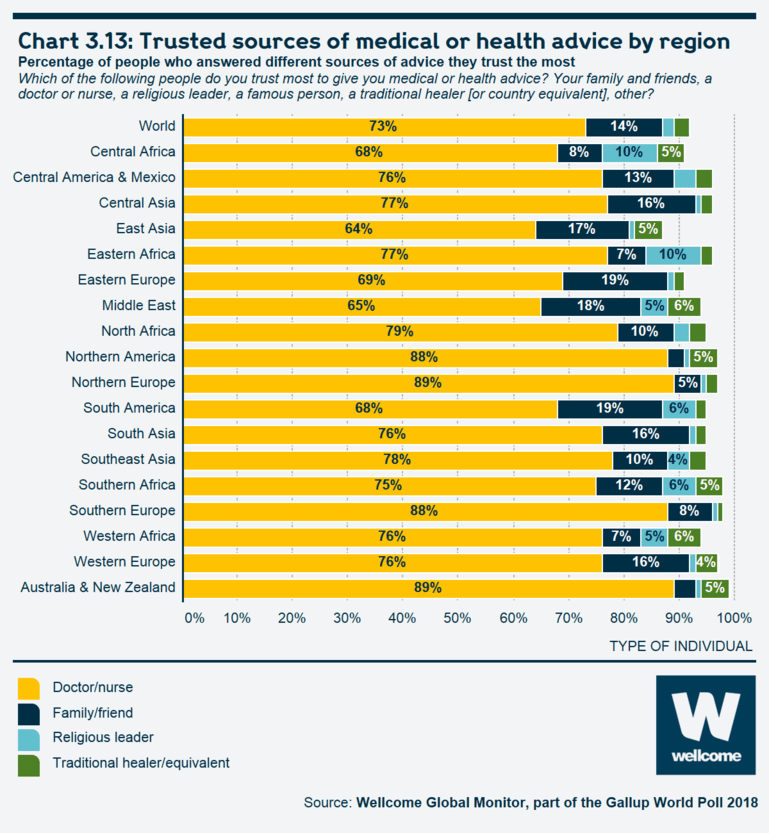
In five regions, fewer than seven in ten people say they would trust a doctor or nurse most for health advice, including East Asia (64%), the Middle East (65%), Central Africa (68%), South America (68%) and Eastern Europe (69%). In nearly all of these places, people are instead more likely to turn to friends and family members, at least compared to other areas. The one exception is Central Africa, where, after doctors and nurses, the next preferred source for health advice is a religious leader.
Chart 3.12: Trusted sources of medical or health advice – global results
See the interactive version of this chart.
Box 3.8: Trust in traditional healers
In ten countries included in the Wellcome Global Monitor, at least one in ten people said they would trust ‘traditional healers’ the most for medical advice. These are: Togo (15%), Mali (12%), Comoros (11%), Haiti (10%), Iran (10%), Libya (10%), Mauritania (10%), Mongolia (10%) Senegal (10%), and Sri Lanka (10%). People in these countries are generally among the least trusting in scientists and doctors/nurses.
Sri Lanka, Ghana, Mongolia, Thailand, Cambodia, Nepal, Palestine and China are also countries where people are most likely to say they trust traditional healers 'some' or 'a lot'.
But in general, the results find that people who trust traditional healers are not necessarily always likely to rely on them for medical advice; overall, among people who trust traditional healers 'a lot', 10% say they trust them most for medical advice.
Chart 3.13: Trusted sources of medical or health advice by region
See the interactive version of this chart.
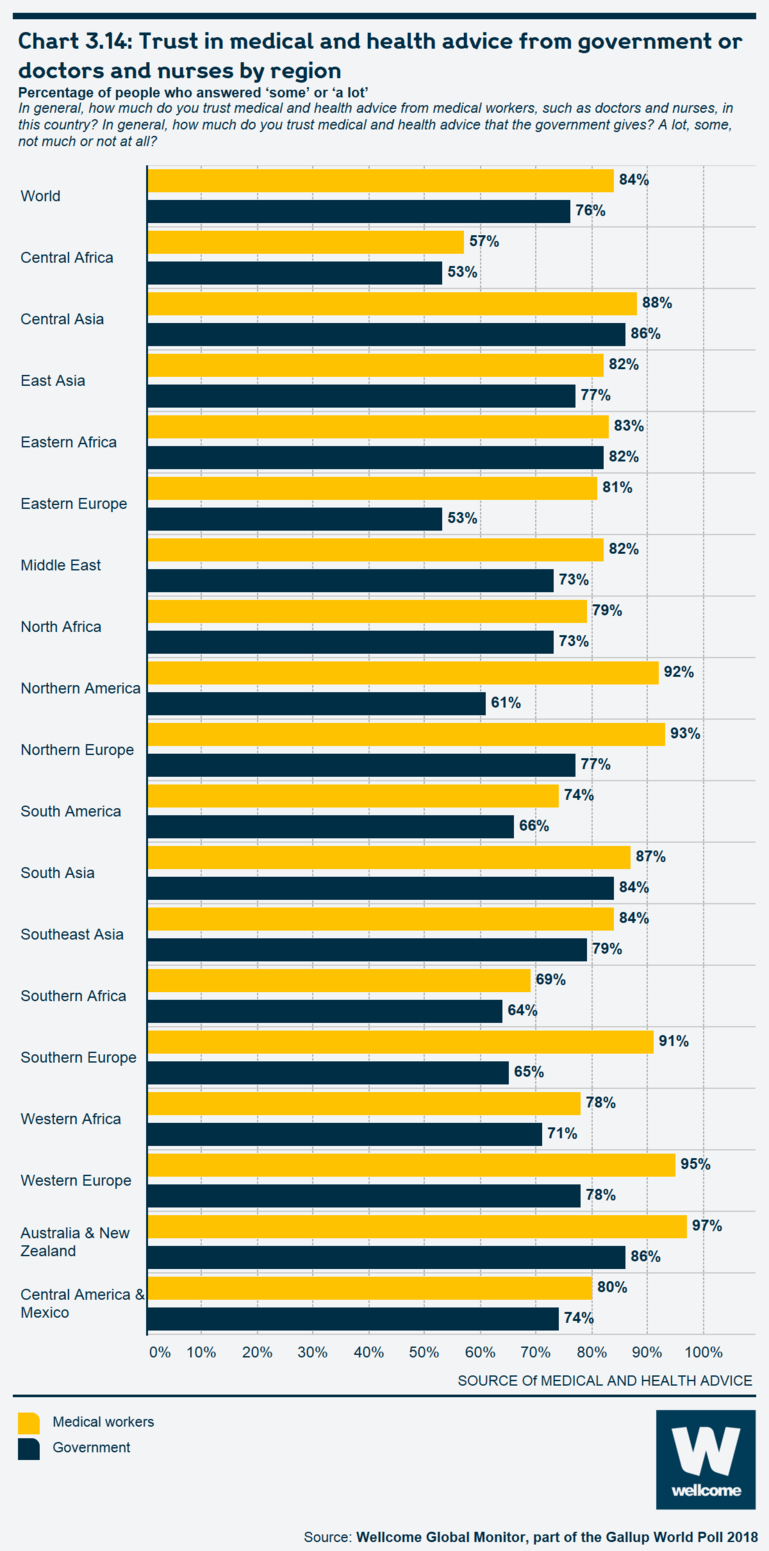
People in Northern America and Europe trust medical and health advice from doctors and nurses more than they do from governments
Worldwide, more than eight in ten people (84%) say they trust medical advice from medical workers (such as doctors and nurses) 'some' or 'a lot'. When asked the same question about trust in medical and health advice from the government, a smaller proportion of people globally – 76% – said they would trust that advice 'some' or 'a lot'.
However, as Chart 3.14 shows, in a few regions, trust in health advice from medical workers outpaces trust in the advice from the government by a wide margin. This is most notable in Northern America, where 92% of people trust medical workers but only 61% of people trust the government for medical advice.
This large ‘trust gap’ in Northern America is largely because of trust attitudes in the US, where 92% of people trust health advice from medical workers 'some' or 'a lot', compared to only 59% of people who trust government medical advice ('some' or 'a lot'). This likely reflects the relatively low trust levels Americans routinely express in their government more broadly.30
The Wellcome Global Monitor finds that only 47% of people in the US say they have 'a lot' or 'some' trust in their government, one of the lowest levels among the very high-income countries.
In much of Europe, people are also substantially more likely to trust health advice from medical workers over that from the government. Similar to the US, many countries in Europe also express relatively low general confidence in their governments.
Chart 3.14: Trust in medical and health advice from government or doctors and nurses by region
See the interactive version of this chart.
Trust in the medical advice of health workers is also relatively high in most other regions of the world, though less so in Central Africa (57%), Southern Africa (69%) and South America (74%). As discussed in other sections of the report, these regions have regularly registered their scepticism about a number of topics related to science and health – including trust in scientists, confidence in hospitals and health clinics, and feeling included (or not) in the benefits of science
Conclusion
Trust is difficult to define. In the survey, we asked people who they trusted, letting their own personal definitions guide their responses and therefore our findings. We were particularly interested in how they felt about science, scientists, healthcare professionals, and health institutions.
The Wellcome Global Monitor identified a small number of factors that seem to relate to people’s trust in scientists, but these factors together only explain a small part of how people’s level of trust varies. To get a full explanation, more research is needed.
However, two factors associated with trust in scientists stand out: people’s education and their confidence in national institutions. Learning about science at school, and continuing to study science to higher levels, is one of the strongest predictors of your level of trust in science.
The survey also found that the level of confidence people have in their national institutions – their government, judicial system, and military – was a good predictor of their level of trust in science. This suggests that in order to engage people with science effectively, we cannot ignore how people feel about their broader social context and their relationship with power and institutions, even though they ultimately tend to trust scientists more than the government or military.
As is consistent with previous research on public trust, doctors and nurses are much more trusted than scientists in all regions, although there is still variation between different parts of the world. Trust in health professionals relates to national health outcomes: Trust also may be higher in countries where health services are more accessible.
People’s level of trust in hospitals and health clinics was much more closely related to their levels of household income than it was to the wealth of their country. In other words, people struggling financially in poor countries had similar levels of trust in hospitals to those in the same position in rich countries. The findings suggest that economic inequality within countries justifiably deserves attention in terms of how people feel about healthcare provision.
If any interactive charts are slow to load, try later or contact our team at wgm@wellcome.org.
Endnotes
- See the Wellcome Global Monitor Questionnaire Development Report and Chapter 1 for more details and references.
- Bauer M, et al, European Public Perceptions Of Science, International Journal of Public Opinion Research 1994;6(2):163–86.
- Bauer MW, Falade BA. Public understanding of science: survey research around the world. In Bucchi M, Trench B (eds.). Handbook of Public Communication of Science and Technology. London: Routledge; 2008. pp. 111–30.
- Please see the details in Appendix A: Methodology [PDF 540KB].II
- UNESCO. UNESCO Science Report, Towards 2030: Chapter 14: Central Asia. Paris: UNESCO; 2015. https://en.unesco.org/USR-contents [accessed 16 May 2019].
- This finding is also supported by UNESCO. World Data on Education (Uzbekistan). UNESCO; 2011: http://dmz-ibe2-vm.unesco.org/sites/default/files/Uzbekistan.pdf [accessed 16 May 2019].
- For instance, a 2011 European Competitiveness Report by the EU found Belgians’ trust in science to be on par with the EU average, though 66% were defined as having trust. European Commission. European Competitiveness Report 2011. Luxembourg: Publications Office of the European Union; 2011. https://ec.europa.eu/growth/content/european-competitiveness-report-2011... [accessed 16 May 2019].
- Bauer M. The Changing Culture Across Old Europe: 1989 to 2005. In Bauer MW, et al (eds.). The Culture of Science: How the Public Relates to Science Across the Globe. London: Routledge; 2012: 92–109.
- European Competitiveness Report 2011, Chapter 3.
- According to the 2018 Gallup World Poll – 62% of people in Niger say they have no formal education. The only other country in Sub-Sharan Africa with a comparable figure is Mali, at 65%.
- Maclean R. The great African regreening: millions of 'magical' new trees bring renewal. Guardian 2018 16 Aug. https://www.theguardian.com/world/2018/aug/16/regreening-niger-how-magic... [accessed 16 May 2019].
- Stith M, et al. A Quantitative Evaluation of the Multiple Narratives of the Recent Sahelian Regreening. Weather, Climate, and Society 2016;8:67–83. https://doi.org/10.1175/WCAS-D-15-0012.1 [accessed 16 May 2019].
- Bauer MW, Falade BA. Public understanding of science: survey research around the world. In Bucchi M, Trench B (eds.). Handbook of Public Communication of Science and Technology. London: Routledge; 2008. pp. 111–30.
- This is also discussed in the Questionnaire Development Report.
- Rai A, Shukla R. Statistical Modelling of Public Understanding of Science. In MW Bauer, et al. (eds.). The Culture of Science: How the Public Relates to Science Across the Globe. London: Routledge; 2012. pp. 262–81.
- Bauer M, et al. What Can We Learn from 25 Years of PUS Survey Research? Liberating and Expanding the Agenda. Public Understanding of Science. 2007;16(1):79–95. https://doi.org/10.1177/0963662506071287 [accessed 16 May 2019].
- UNESCO. (2015). UNESCO Science Report, Towards 2030. Paris: UNESCO; 2015. 54. https://en.unesco.org/USR-contents [accessed 16 May 2019].
- Weinbach RW. When Is Statistical Significance Meaningful? A Practice Perspective. The Journal of Sociology & Social Welfare 1989;16(1):31‑7. http://scholarworks.wmich.edu/jssw/vol16/iss1/4/ [accessed 16 May 2019].
- This is known as a margin plot. For any given level of an independent variable, the predicted trust in scientists score would be calculated with all other factors in the model being kept at their average level.
- This question was not asked in countries where elections are not held.
- The two were measured on a continuous scale, meaning they can theoretically take any numeric value in the same way the area of a room can. The Gallup World Poll Communications Index is a summary variable that takes a value between 0 and 100, with a higher score indicating a person has access to a greater diversity of communication and information technology, including mobile phones and the internet. See Appendix B: Questionnaire [PDF 2.13MB] for more information on this.
- This is the simple average of these 11 countries, i.e. projection weighting was not used.
- Based on World Bank data. To calculate regional averages, projection weighting was used, which adjusts for country population. See Appendix A: Methodology [PDF 540KB] for more information on external data sources used in the analysis or projection weighting.
- As provided by the World Bank. Higher rates of deaths by these causes implies a lower risk of death from communicable diseases. For more about external data sources used in analysis, see Appendix B: Questionnaire [PDF 2.13MB].
- Huang EC, et al. Public Trust in Physicians – Health Care Commodification as a Possible Deteriorating Factor: Cross-sectional Analysis of 23 Countries. Inquiry 2018;55:1–11. doi:10.1177/0046958018759174 [accessed 16 May 2019].
- Huang EC, et al. 2018.
- Sterck O, et al. Average income per capita, health outcomes, and the allocation of development assistance for health. VOX CEPR Policy Portal 2018 16 February. https://voxeu.org/article/average-income-capita-health-outcomes-and-allo... [accessed 16 May 2019].
- Sterck O, 2018.
- Newey, S. From horror to health: How Rwanda rebuilt itself to become one of Africa's brightest stars. The Daily Telegraph, https://www.telegraph.co.uk/news/0/horror-health-rwanda-rebuilt-become-o....[accessed 25 May 2019].
- Refers to Gallup US data, which asks Americans about their trust in different aspects of the government or its ability to perform different responsibilities. A summary of the data can be found here: Gallup. Trust in Government. https://news.gallup.com/poll/5392/trust-government.aspx [accessed 16 May 2019].